People Engagement Demo Description

People Engagement is an application based on a microservices architecture that performs real-time people detection and head orientation analysis to determine individuals' engagement with a configured target. Using this data, it generates statistics such as the number of people engaged within a given time window, total and average engagement duration, and a heatmap indicating the locations where engagement occurred.
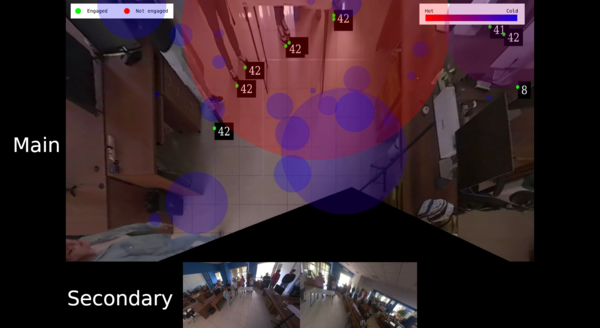
The application provides a dashboard displaying these statistics, along with a Bird’s Eye View (BEV) of the combined input streams. On top of the BEV, it overlays the heatmap and displays tags for each detected person, indicating their engagement status (engaged/not engaged) and their corresponding engagement time.
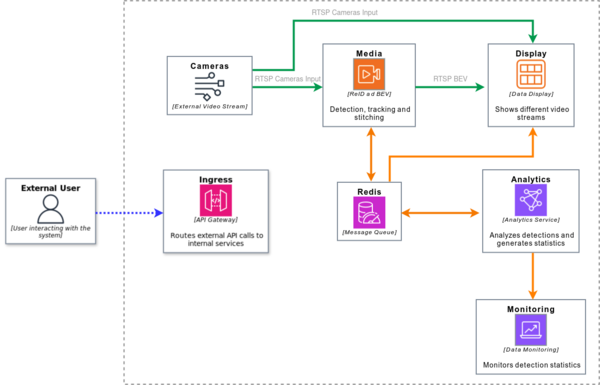
The following diagram shows the application structure.

- Camera Service: This service captures video from multiple cameras simultaneously and generates an individual RTSP stream for each camera.
- Media Service: This service receives RTSP streams, performs detection and head direction estimation for all detections across the input streams, and maintains consistent person IDs across all cameras using re-identification (ReID). The results are published to Redis. Additionally, the service generates an output RTSP stream that provides a Bird’s Eye View (BEV) combining all input streams.
- Engagement Analytics: The Engagement Analytics service reads detections and head orientation data and, based on a configured target, performs engagement estimation. It generates statistics such as total and average engagement time, engagement per ID, and visitor count. These statistics are then sent to InfluxDB. Additionally, the service calculates a heatmap of engaged individuals and publishes it to Redis.
- Display Service: The display service presents a mosaic view with the main video showing the Bird’s Eye View (BEV) stream alongside the individual camera streams. Additionally, it overlays the BEV with the engagement heatmap and tags for each person, indicating whether they are engaged or not, along with their engagement time. This information is shown in the board's display, and it looks like this:

- Monitoring Service: The Monitoring service consists of two applications: InfluxDB, which stores all the statistics generated by the Analytics service, and Grafana, which is used to create a dashboard for visualizing these statistics. The dashboard looks like this:


